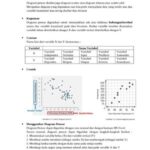
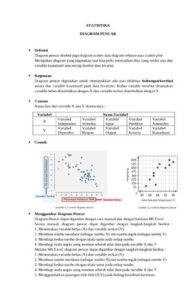
Discover the connection between pocket money and savings with Bu Novita. Learn how to analyze the relationship between expenses and savings. Find insights by creating a scatter plot based on the data collected. Explore examples like visitor turnout and book sales revenue at an exhibition or the correlation between land area and population density in an Indonesian province. Uncover the power of scatter diagrams to visualize quantitative data relationships. Master statistical analysis with…