• Home /
  • solutions /
  • Math /
  • The circle graph above gives the distribution of salad dressing chosen by customers at a restaurant. If approximately 200 customers order salad each day at the restaurant, which of the following is closest to the difference per day between the number who choose Italian dressing and the number who choose Vinaigrette dressing?

The circle graph above gives the distribution of salad dressing chosen by customers at a restaurant. If approximately 200 customers order salad each day at the restaurant, which of the following is closest to the difference per day between the number who choose Italian dressing and the number who choose Vinaigrette dressing?

The circle graph above gives the distribution of salad dressing chosen by customers at a…

Answer

$$30$$

Explanation

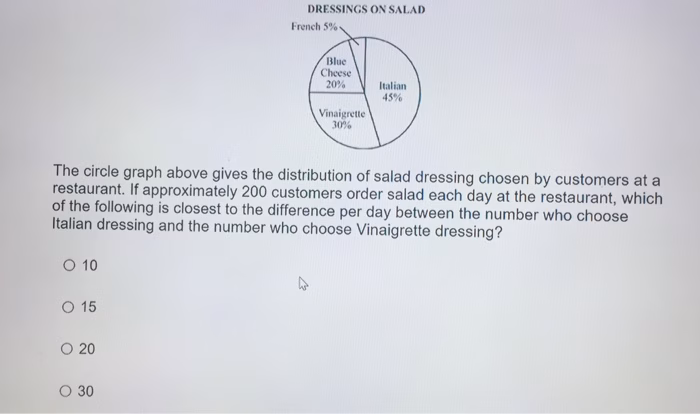
  1. Calculate the number of customers who choose Italian dressing by taking $$45\%$$ of $$200$$, which is $$200×45\% = 90$$
  2. Calculate the number of customers who choose vinaigrette dressing by taking $$30\%$$ of $$200$$, which is $$200×30\% = 60$$
  3. Find the difference between the number of customers who choose Italian dressing and vinaigrette dressing, which is $$90 – 60 = 30$$